citations
ML Application Development Made Easy: Streamlit Basics
Streamlit is a powerful, ML-focused framework that makes it easy to build visually appealing ML applications and enhance your existing ML code.


If you’re someone who is just getting started with Machine Learning or dabbles in the field occasionally, there is a good chance that you’ve been using Jupyter notebooks (either on your local machine, Google Colab, or Kaggle) as your primary compiler and editor. It makes sense due to all the great features it has to offer — being able to execute chunks of code at a time, the ability to share the same notebook across different platforms, fluid integration of markdown and latex, and most importantly, great readability.
But what if you’ve developed some really insightful visualisations, or want to tune the parameters of your model before you train it? Or you simply want to generate predictions from the model without getting into the nitty-gritty of scrolling through the code and editing some obscure line for the value of ‘k’ in your KNN algorithm? And to make things worse, you realize that the notebook has disconnected from the host and you have to execute every single code cell from the beginning! Frustrating, isn’t it?
Now, don’t get me wrong, I’m not looking to condemn or even replace Jupyter notebooks. They are extremely resourceful in their own right and there is a reason for all its ubiquity in the ML world. But after a certain point of tinkering and testing the code, an application must be developed. A tool that anyone can interact with, and generate useful information out of, easily.
Let’s take the example of Spotify to understand this better. Checkout this article to understand how Spotify recommendations work. Imagine if Spotify developed BaRT on a Jupyter notebook, or even a piece of script, and then asked you to manually upload a list of song names that you listen to. In return, it would let you download a list of songs that it thinks you’d like. Now functionally, this works exactly as Spotify does. Practically, it’s a disaster. At the same time, if you’re anything like me, you’re lazy and you probably don’t want to go the full extent of developing a full fledged cross platform application from scratch. The solution? An open-source application framework developed by and for the ML community.
Streamlit allows you to create a visually appealing and functional UI that works directly with your python script. With a few extra lines added to your existing code, you can create an appealing front end that wouldn't scare away a lot of people.
To begin with, I will cover the basics in this article, primarily for people who will be using Streamlit for the very first time. Depending on the response, I might turn this into a series of articles to explain the other quirks and features.
Setting up the environment
I’ll be detailing out the steps for a machine running MacOS. I believe the steps are not very different for a Windows or a Linux machine.
Although the Streamlit documentation recommends another way of setting it up, I prefer using Anaconda for its ease of use in package management and setting up virtual environments. You can download the individual version from their website and follow these steps to install it.
Once installed, open Anaconda Navigator.
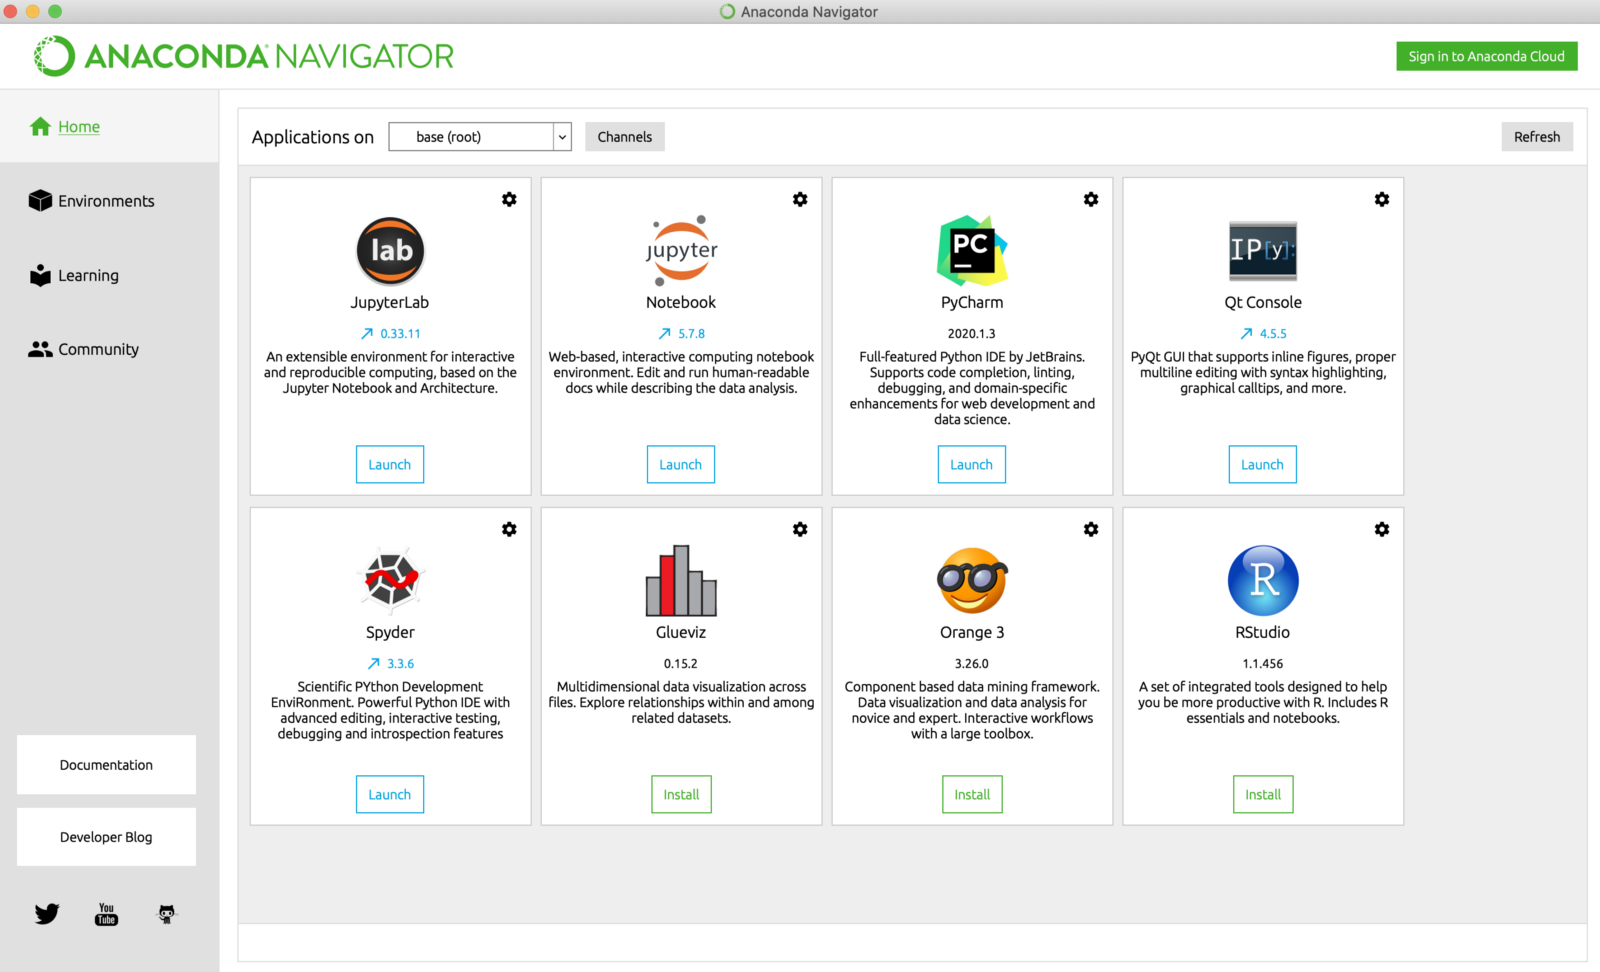
On the left hand side menu, select ‘Environments’.
On the bottom bar, select ‘Create’. You should see a popup window, fill it out as follows.
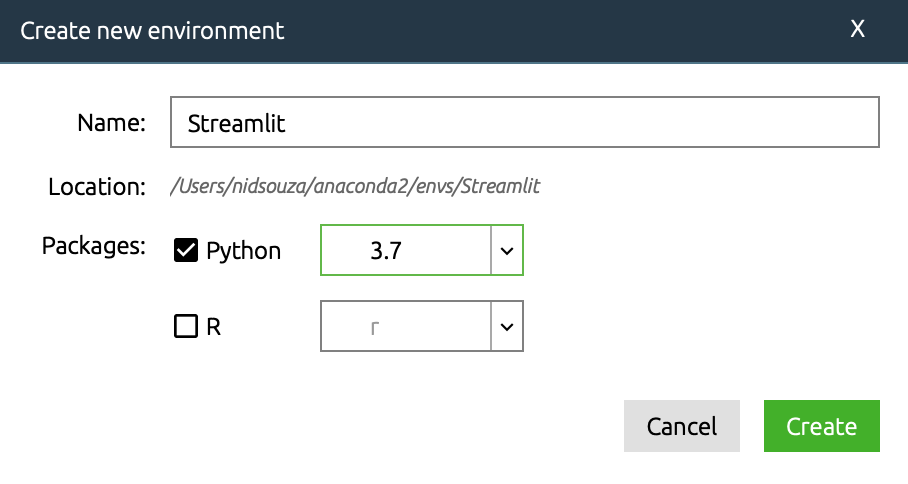
Once you click ‘Create’, Anaconda will take a few minutes to install and set up a few basic packages. Once complete, you should be able to see the list of packages.
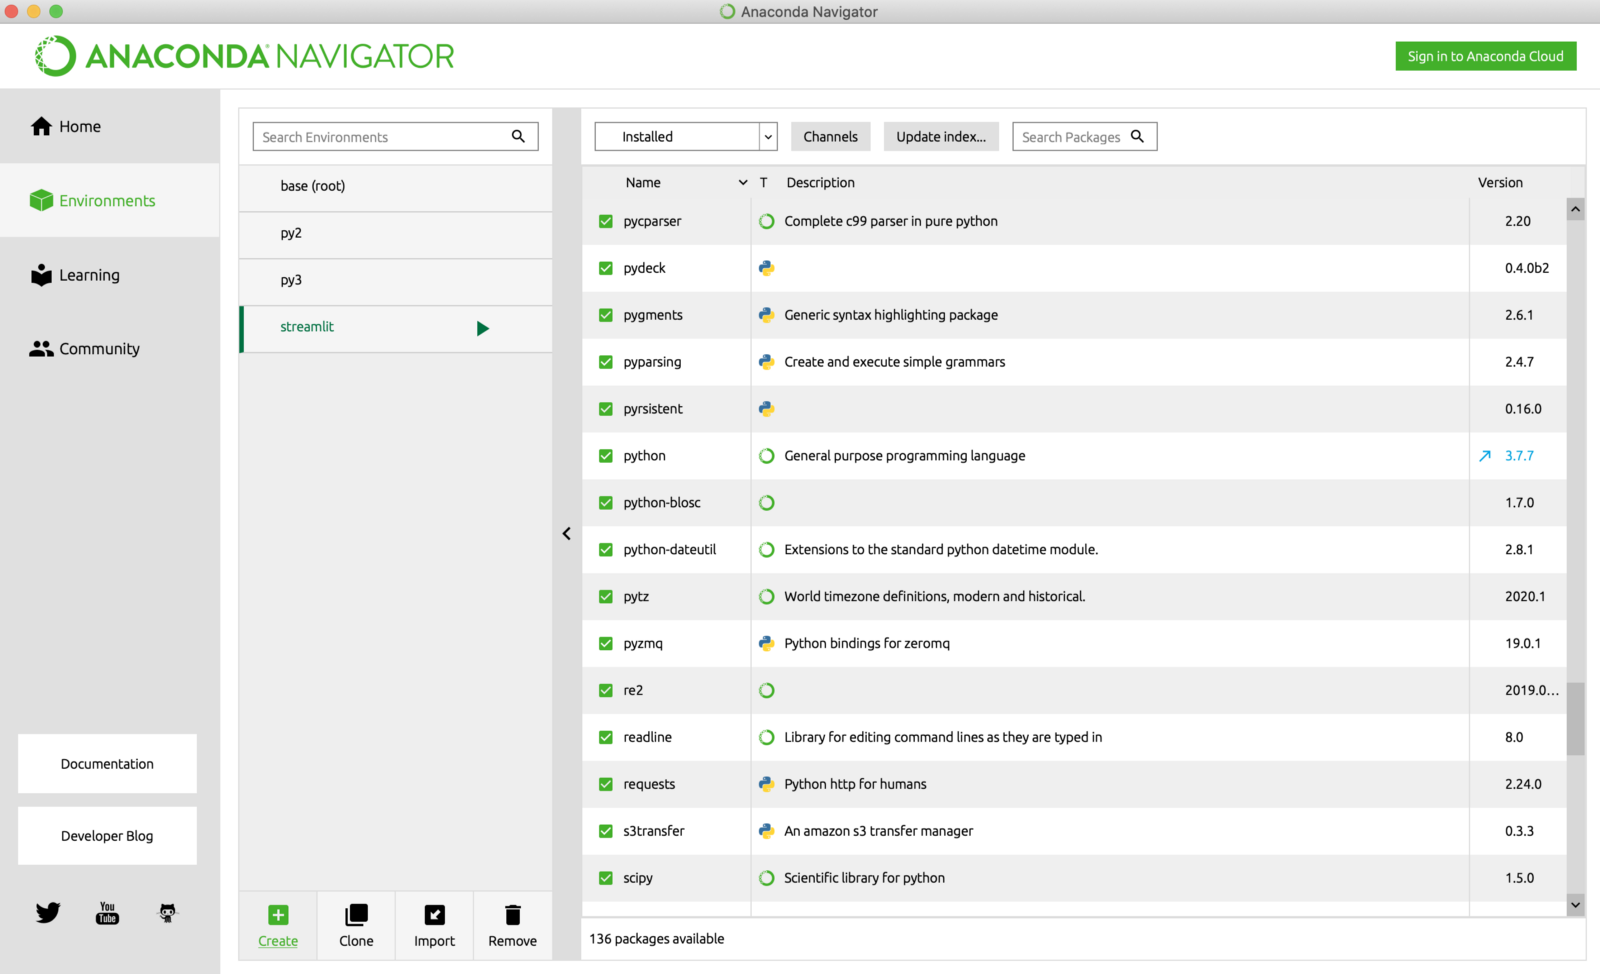
I prefer to have a separate environment only for Streamlit so that I can easily keep a track of the versions and modify them without affecting my other projects.
Open Terminal. If everything is setup correctly, you should be able to execute the command conda activate streamlit and see (streamlit) in your terminal.

This simply means that the ‘streamlit’ environment (that you set up earlier) is now active.
To make sure Streamlit has been installed correctly, let's execute the maiden command Streamlit hello.
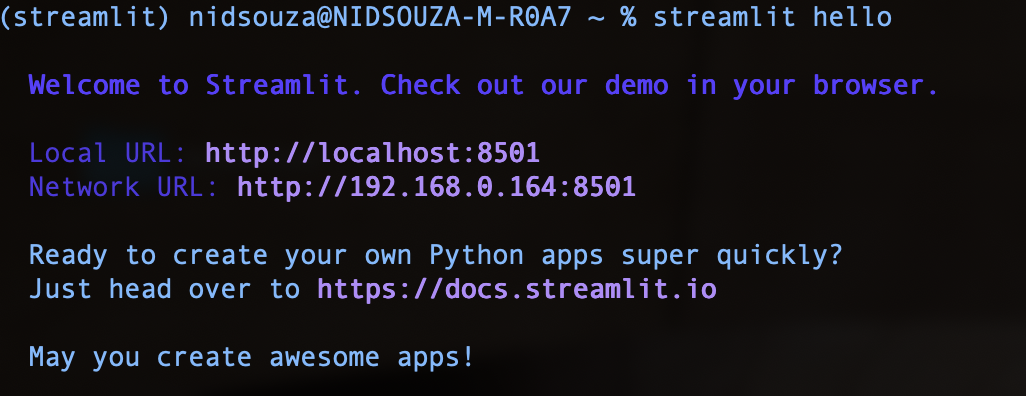
At the same time, your browser should load this page automatically.
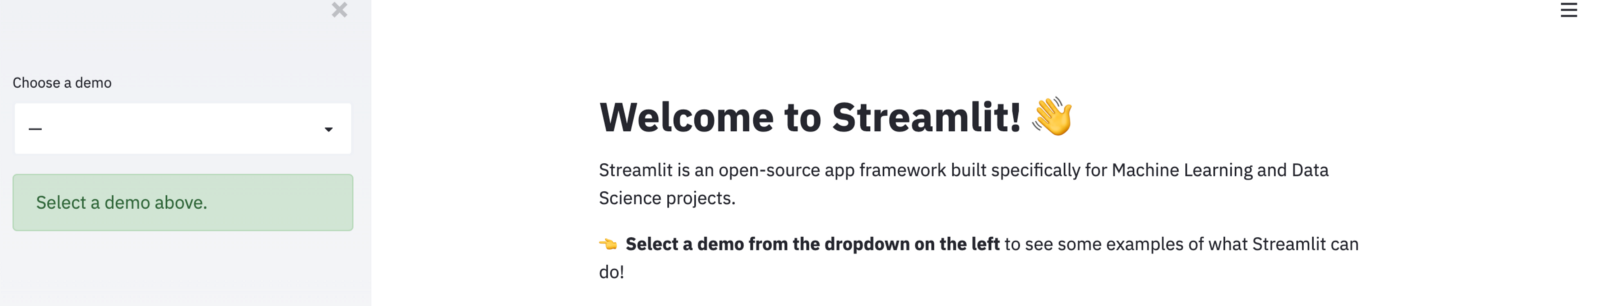
If you see this page, streamlit has been set up successfully.
Cool Tip: You can use another device (such as an iPad, phone or even another machine) and access the front end page using the IP mentioned in the terminal. As long as they are connected to the same (WiFi) network, it should work. This feature is useful during the development process, especially when you don’t have access to an external monitor and want to observe live changes in the UI.
To stop the server, execute Command+C in the terminal window.
Although this is optional, I would highly recommend that you checkout the book ‘Approaching (Almost) Any Machine Learning Problem’ written by Abhishek Thakur. Chapter 5 talks about ‘Arranging machine learning projects’ and as the name suggests, it helps arrange your different project files in an organised manner.
Let’s start by creating a python file inside the ‘src’ folder for Streamlit to run. The ‘src’ folder is simply a directory that contains the python files of my project. We will use Jupyter script to edit the files. But you can use pretty much any Python IDE that you prefer.
Run the command jupyter notebook inside the ‘src’ folder. This should start the jupyter server and load the front end. Start by creating a new Python3 script.

Start by selecting ‘Text File’ and then edit the file name to ‘first.py’ (or any name really, but include the .py extension).
Time to code!
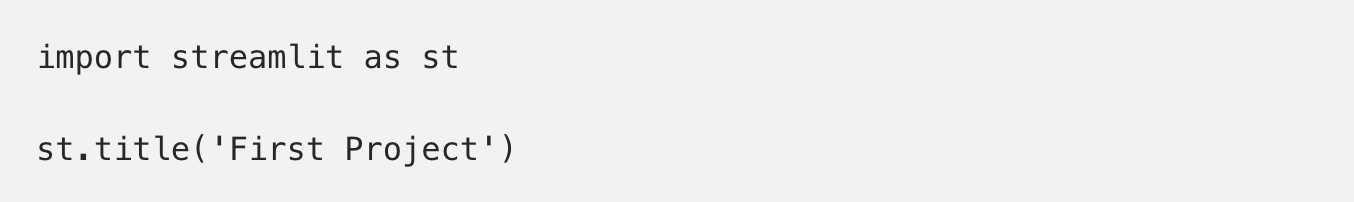
Let’s start simply by adding a title to our application.
Save the file (Command+s), unless your IDE has auto save enabled.
In a new tab (make sure the ‘streamlit’ environment is active), navigate to the ‘src’ directory and run streamlit run first.py
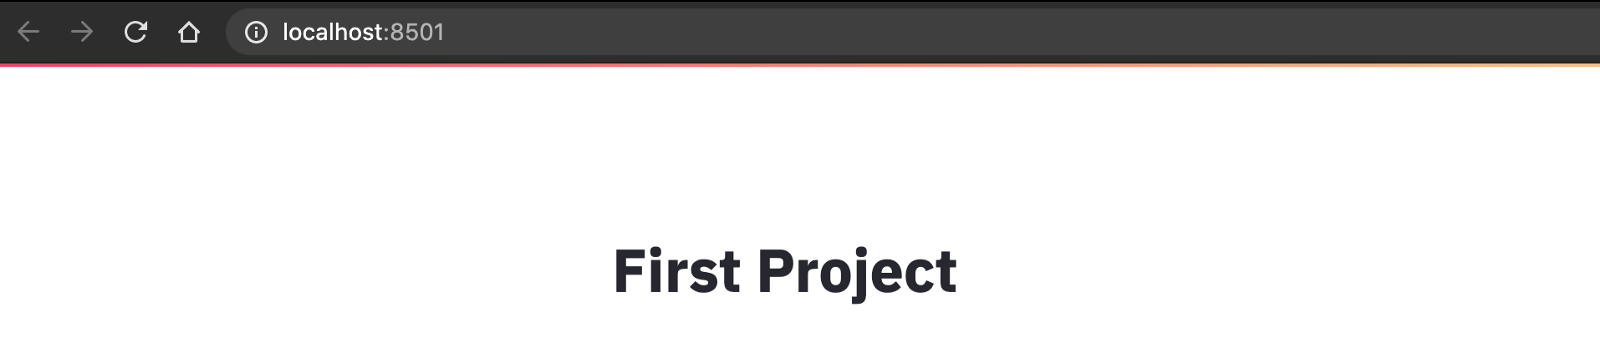
When you make a change to the script, streamlit will automatically detect the change and prompt you (on the top right hand corner of the application) to either ‘Run’ or ‘Always Run’. Essentially you can either manually refresh the application or set it to automatically detect and refresh on every change.
Similarly, you can use the ‘write’ function to simply print text:

If you’re yawning already, I don’t blame you. Text can get boring. So let’s jump into creating widgets.
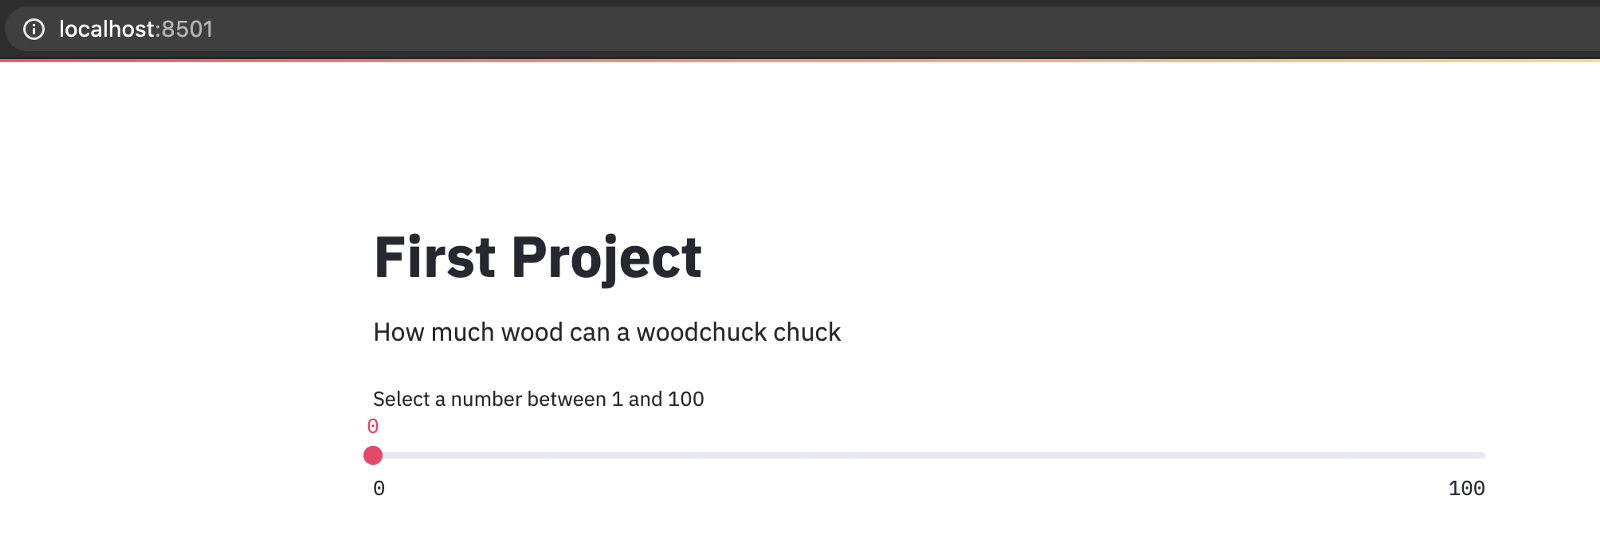
The ‘slider’ widget is a simple element that allows you to easily select a value for a variable. Try this code:

Based on the selection made by the user in the UI, the value of ‘x’ is set in the code.
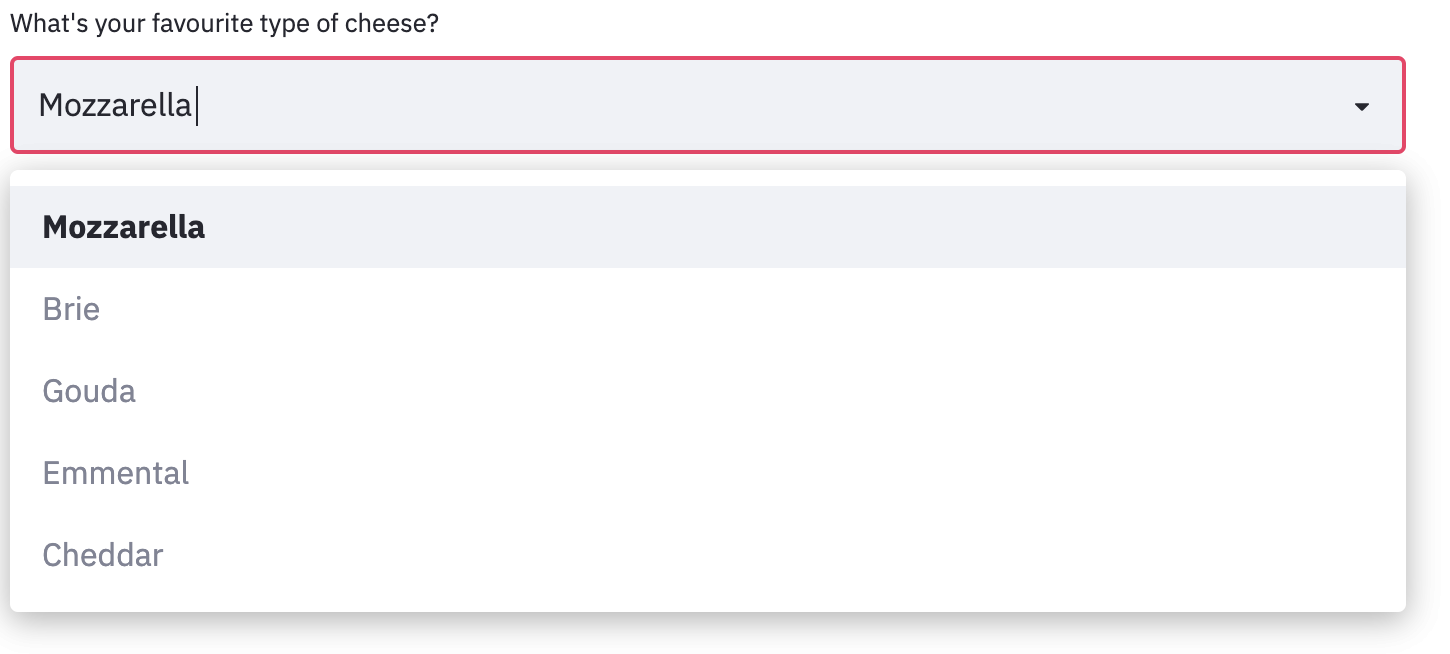
Similarly you can add dropdown selections:
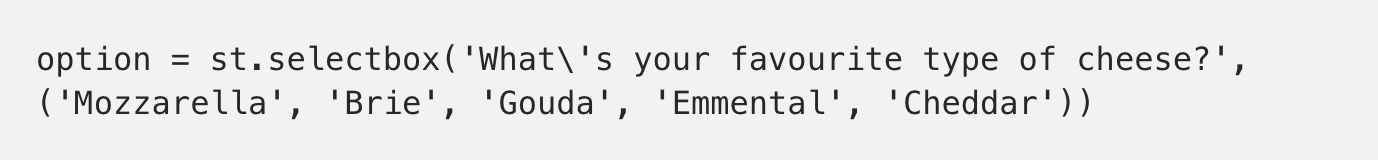
The string value of ‘option’ is set based on the user selection from the UI.
Let’s experiment with some other common visualisation elements.
The structures widely used to store large datasets are dataframes and it’s sometimes useful to view them directly in the application.
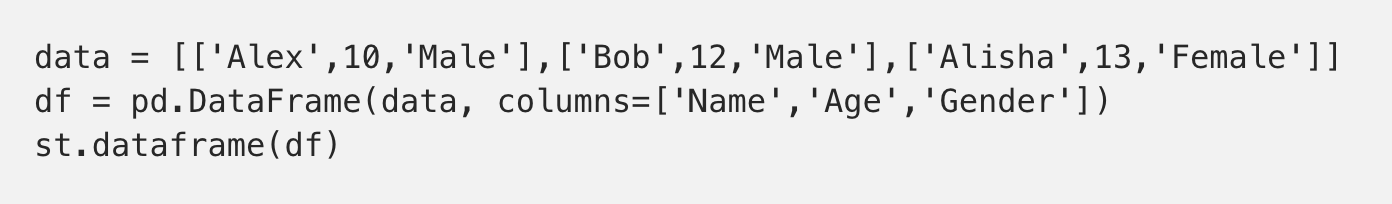
This simple dataframe should look something like this:
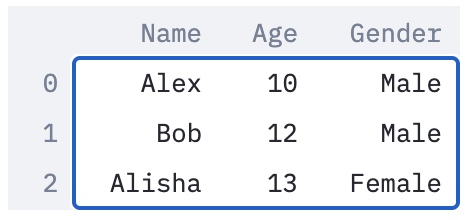
Alternatively you can also use st.write(df) for a similar output
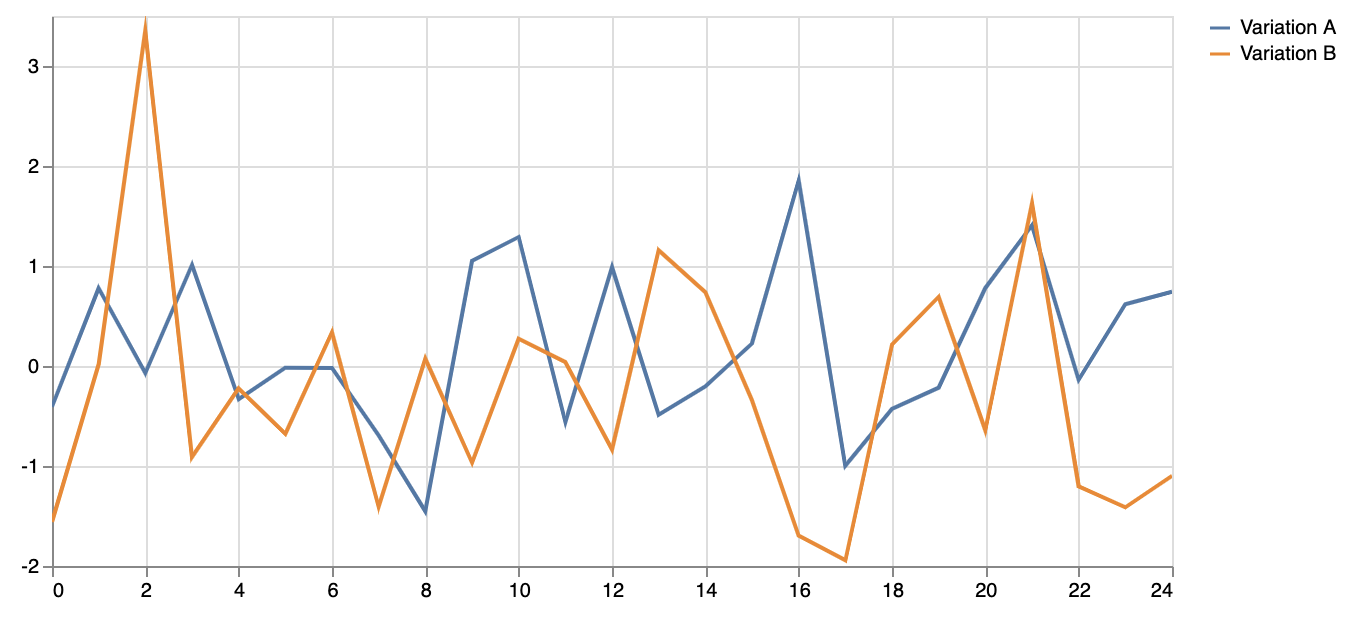
Visualising data using charts is quite common and can be easily done in Streamlit. Streamlit allows a variety of visualisation elements such as bar graphs, scatter plots, plotly, pydeck, etc. I’ll be taking the simple example of a line chart.
Using the numpy.random function, lets generate some random data and plot this:
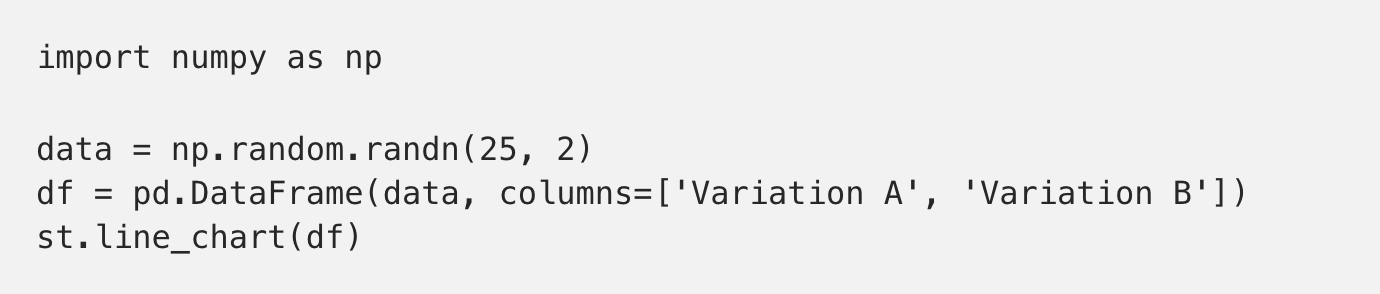
This should create a simple chart as such:
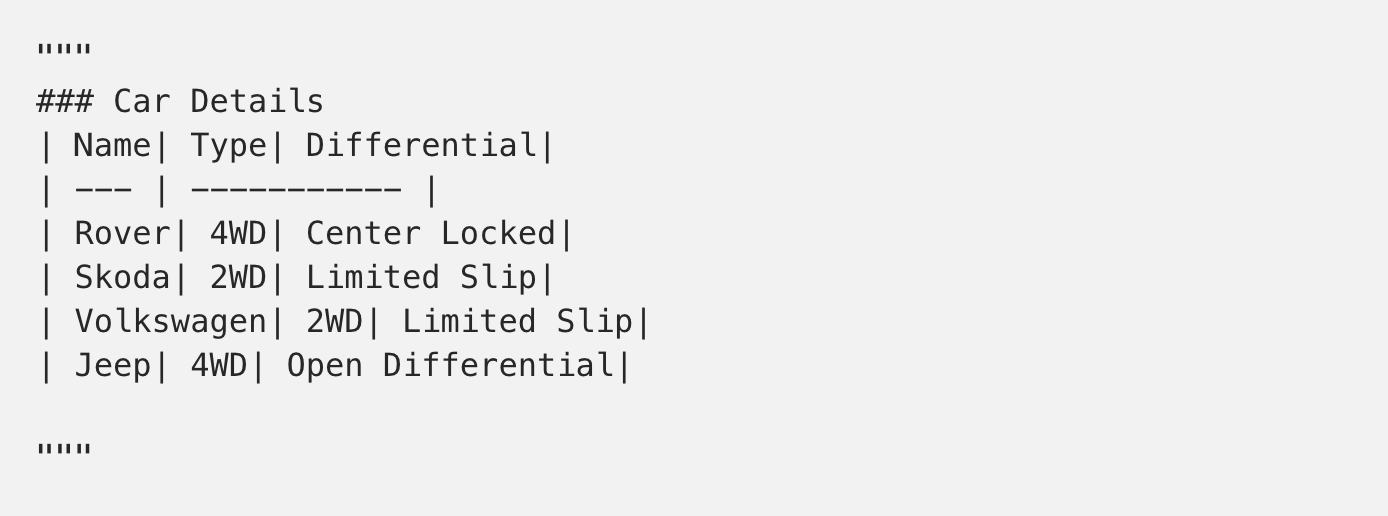
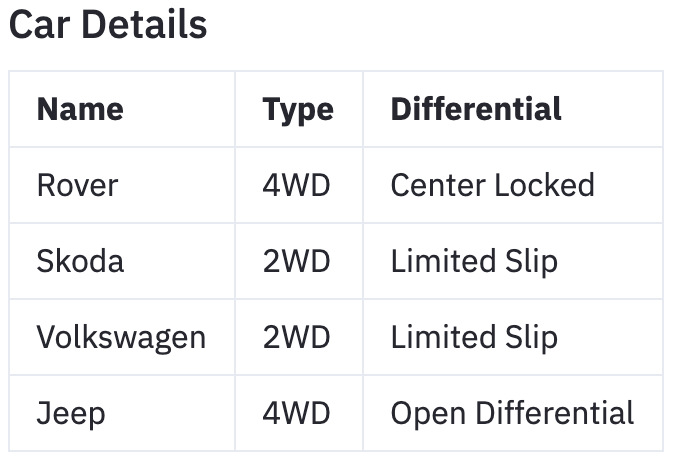
While developing an application, you might have a lot of text, and using the st.write() function multiple times might get messy and cumbersome. Fortunately streamlit supports ‘magic commands’ which is a neat way to integrate textual information. Simply include your text within a set of triple double quotes. Streamlit is also smart enough to detect and ignore docstrings (text on top of files and functions).
Streamlit also supports LaTeX. Although it does have a dedicated function st.latex for it, you can make use of ‘magic’ and it would automatically detect it.

I hope this article gets you started in building a basic application using Streamlit. There are a lot of aspects that I haven’t touched to avoid information overload in the very first post itself. I would highly recommend that you take an existing project (if you have one) and start integrating these elements within the code. Also checkout their documentation for the full list of available features.

.png)

.png)